
History of Woodland Drives
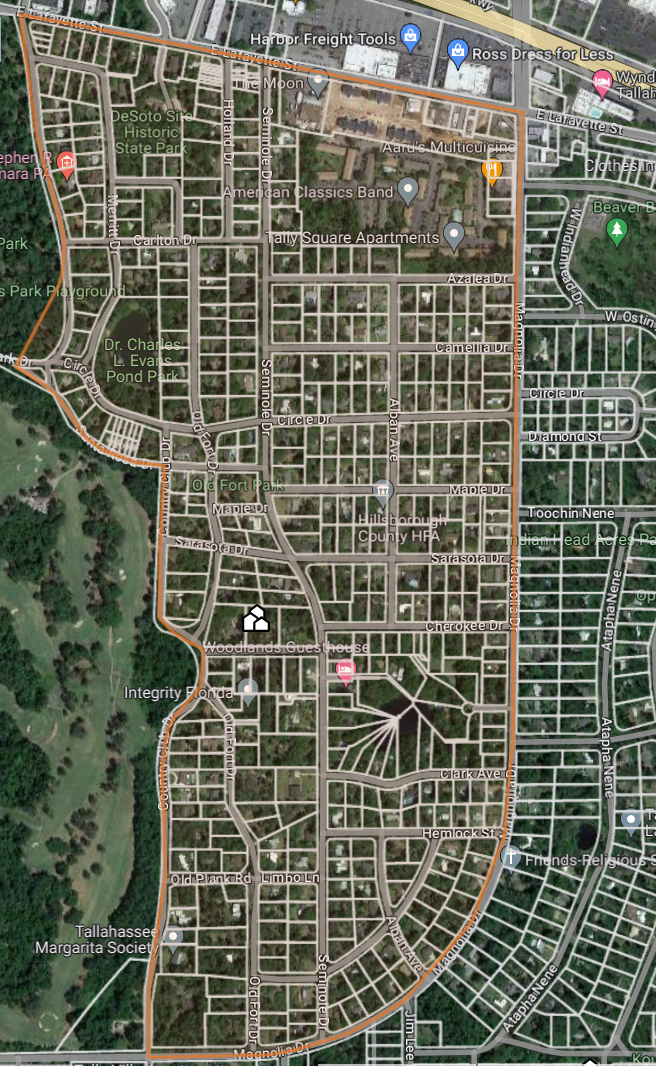
Woodland Drives is one of the oldest neighborhoods in Tallahassee. On average, the homes are between 70 and 50 years old. The neighborhood has approximately 450 homes, with an unusual mix of single-family homes and townhouses. According to the HOA’s website, “Many of our residents have lived in the neighborhood for generations–indeed, Woodland Drives boasts succeeding generations living in the same home!”
Within a long walk of the Capitol Complex and downtown Tallahassee, there are many green spaces and havens for wildlife. The area also has a rich history. This area has been popular with archeologists with finds from the 1600s to the early 1500s and evidence of earlier settlers. They have even found remnants of the explorer de Soto’s winter 1539 encampment.
Real Estate of Woodland Drives
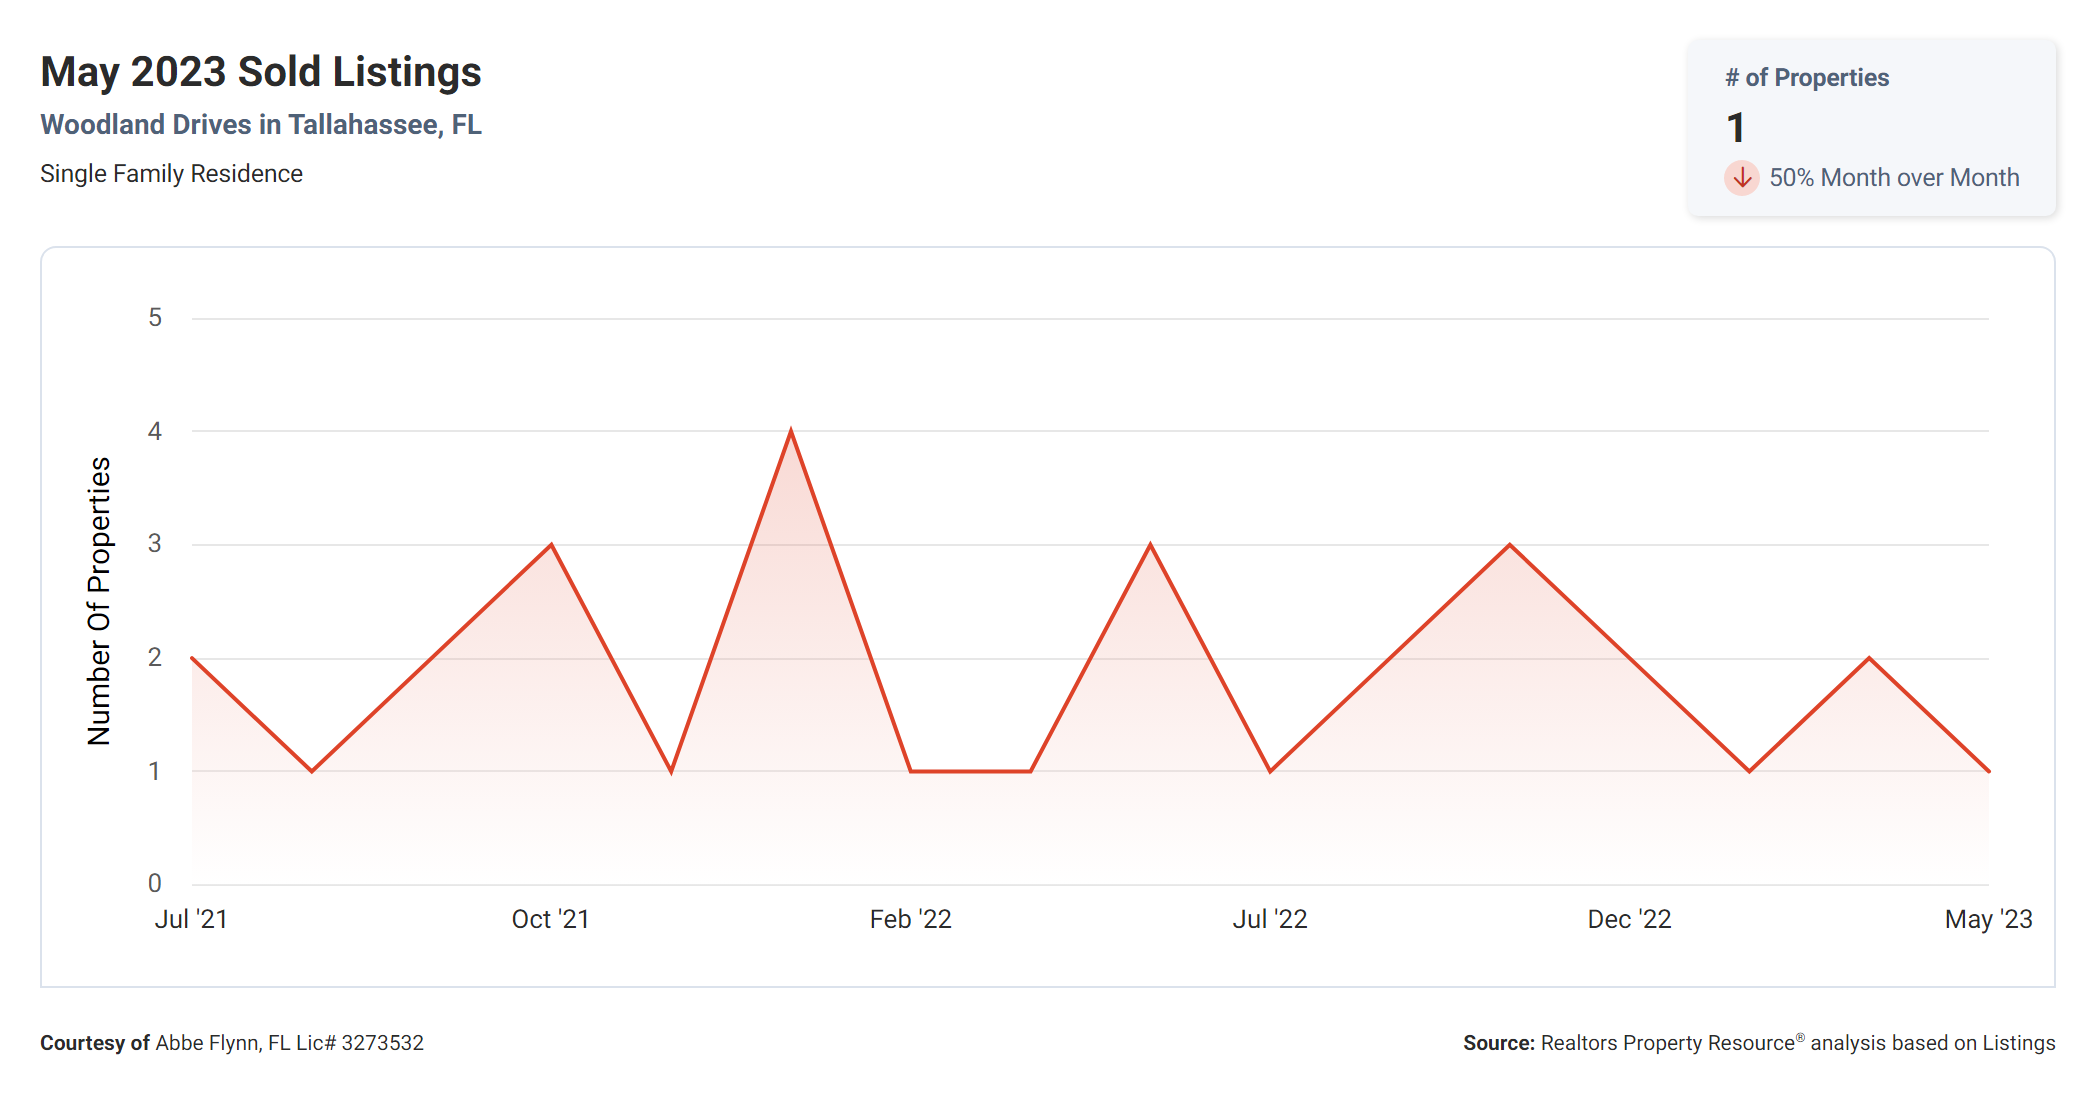
Nine homes were sold in Woodland Drives in 2022, and 21 were sold in 2021. The homeowner’s association fee is listed as $0 a year. Check out the link below for the HOA’s website.
Even though some of the homes in Woodland Drives are older than the average Tallahassee home, these remodeled homes sell quicker than average. In 2022, the median age of the homes sold was 65, and the oldest house was 75. The average days on the market for 2022 was twenty-six days. The longest days on the market was only 67.
The median home sale in Woodland Drives for 2022 was $368,000. That is almost a third higher than the home sales in 2021. On average, the houses sit on over half of an acre and are 2,043 square feet. Less than 10% of the homes sold had pools, and more than 90% had fireplaces. These tree-lined streets are gorgeous and stately.
Woodland Drives Homeowners’ Association website and other relevant links:
HOA: Woodland Drives Homeowners Association
There’s a note that they will be updating the website soon. Stay tuned. There are some really cool photos of the neighborhood and history too.
Facebook Group: Woodland Drives Facebook Group
This neighborhood is located in the Tallahassee zip code of 32301.
Detailed Reports for Woodland Drives
These reports are available for licensed Realtors and pull data from various resources. Niche creates the school reports, and Esri collects the trade area data. These reports are updated upon request and posted regularly. Please subscribe to our blog to receive updates.
The Neighborhood
The Woodland Drives neighborhood report includes charts and statistics about housing, people, economics, and quality of life. As of July 2023, home values rose 9.3% year over year. The median home age is fifty-seven, and 60% of residents are homeowners. The median age of residents is forty-four, with a median household income of $69,583.
Download the July 2023 report here: Neighborhood Report for Woodland Drives.
The Real Estate Market Reports
The market activity report details the active and pending listings and recent sales in Woodland Drives. These reports will be updated periodically. If you are interested in an updated copy, contact us! See an overview of the most recent sales below.
Download your July 2023 report here: Market Activity Report for Woodland Drives.
The Trade Report
The Commercial Trade Area Report breaks down the socioeconomic and demographic segments of Killearn Estates. Based on Esri Tapestry data, the primary segments are displayed numerically, with #1 being the most dominant. The residents’ characteristics and spending habits are explained in detail.
The largest segment of residents in the Woodland Drives neighborhood is the Emerald City segment. These consumers are college educated, and many have embraced Tallahassee’s vibrant ‘foodie’ culture. The group is highly connected and uses the internet for everything from entertainment to making environmentally friendly purchases. Music and art are significant sources of enjoyment for this consumer segment.
Download the July 2023 report: Commercial Trade Area Report for Woodland Drives.
Real Estate Details for Woodland Drives
| Woodland Drives – numbers at a glance… | |
| Income Per Capita: | $45,854 |
| Median Household Income: | $69,583 |
| Percentage of owner-occupied homes: | 60% |
| Number of 2022 DSF homes sales in MLS | 9 |
| 2021 number of home sales in MLS: | 21 |
| Range of years homes built (MLS Sold 2022): | 1947-1978 |
| Average yearly dues listed MLS (2022): | $0 |
| Home prices (MLS Sold 2022): | Ranges: $228,000 – $487,000
Median $368,000 |
| Size of houses (MLS Sold 2022): | Ranges: 1,625sf – 2,486sf
Average: 2,043 sf |
| Average size of yards (MLS Sold 2022): | 0.53 acres |
| Sold Price Per Square Foot (MLS Sold 2022): | Ranges: $140.31 – $215.29
Median $175.32 |
For the sales in 2022, 7 (or approximately 80%) of the houses sold had fireplaces, and only 1 or 10% had pools.
Parks Near Woodland Drives
For the sales in 2022, 7 (or approximately 80%) of the houses sold had fireplaces, and only 1 or 10% had pools.
Shopping Near Woodland Drives
For the sales in 2022, 7 (or approximately 80%) of the houses sold had fireplaces, and only 1 or 10% had pools.


If you are considering a move within Tallahassee or to Tallahassee, I would love to help.
Abbe Justus, Broker Associate
Ketcham Realty Group
850-321-0920 (call or text)